If you work in advertising or marketing, you’re probably aware of Apple’s privacy efforts over the last year. Apple now requires apps ask customers if they want to 'opt-in' to allow behavioral data tracking. If you’re an Apple customer, you may also think you have control over which apps are tracking you around the internet.
Or do you? We did some research to find out if perceptions match reality. 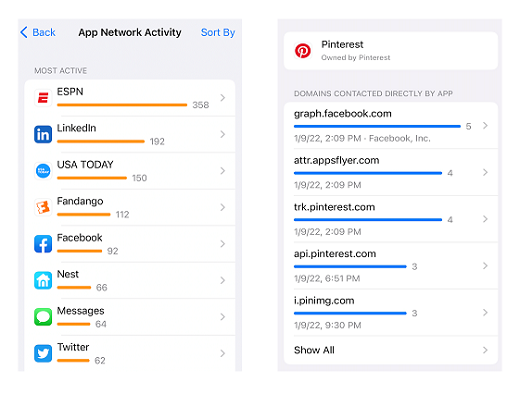
The release of iOS 15.2 introduced a new Record App Activity feature that lets you see which apps communicate to various networks. Sometimes these contacts are to the app’s own domain, but more often these contacts are to third-party domains, and it’s not clear what data is being shared.
We used this new privacy feature to take a snapshot of network connections across 200 apps and 20 different app categories. Our goal was to glean some insight into where the industry is at this moment when it comes to tracking consumers around the internet while also trying to move to a non-PII framework.
Key Findings
Our research found the average app contacts 15 domains, with 12 of those being to unfamiliar third-party domains (roughly 80%). Each app was downloaded and opened only once without registering for the service to understand the starting set of connections.
The results raise important questions about the alignment of consumer perceptions and potential behavioral tracking still taking place when permission to track is not granted.
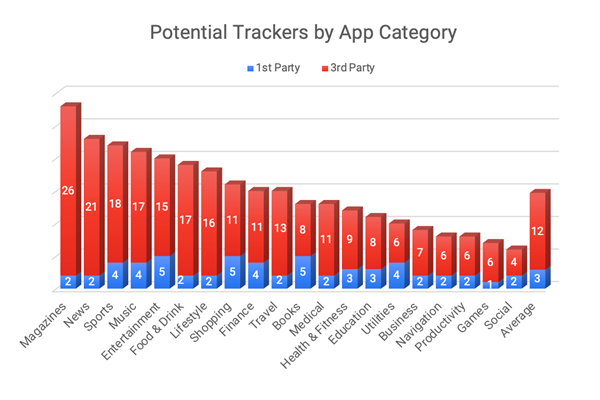
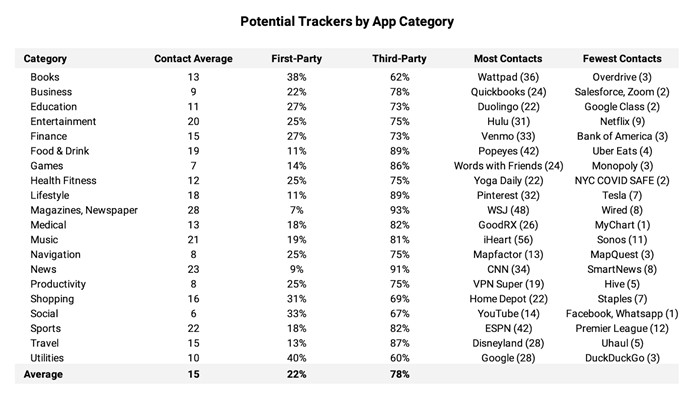
- Magazine apps had the highest number of total network contacts (28), and the highest percentage of third party domain contacts (93%)
- Social apps, followed by Games apps, made the fewest number of network contacts, 6 and 7 respectively. (Note: our methodology of not logging into an app’s service contributed to lower counts for Social apps, since little else is visible in those apps upon first-open.)
- Apps making the most number network contacts included iHeartRadio (56), Wall Street Journal (48), ESPN (42), Popeyes (42), and WattPad (36)
- Apps making the fewest number of contacts include Whatsapp (1), Zoom (2), MyChart (2), DuckDuckGo (3), and Bank of America (3)
- Categories with the highest percentage of first party network contacts include Utilities (40%), Books (38%), Social (33%)
- Categories with the highest percentage of third party domain contacts include Magazines (93%), News (91%), Lifestyle (89%)
- Apps with the highest percentage first party contacts include DuckDuckGo (100%), Google Play Books (100%), Google Classroom (100%), Microsoft Onenote (100%), Google Drive (88%), Amazon Shopping (81%), Apple Music (75%), Google (73%), Amazon Music (71%)
- Out of the 2,800 third-party domains contacted by apps in our research, the most frequent were apple.com, googleapis.com, crashlytics.com, app-measurement.com, and facebook.com
Why it Matters
- Consumers who have not granted permission to be tracked will be alarmed by the number of 3rd party networks contacted by apps - even with minimal app use
- Consumers are currently unable to see what data is shared with 3rd party networks, or how their data will be used. (We predict Apple will work to include in the app privacy reports snippets of actual data shared by the app to each 3rd party network.)
- Consumers do not currently have the ability to disable potential trackers - their options are either use the app or not. (We predict Apple will work to give consumers the controls to disable specific trackers and networks from receiving information from each app.)
- App developers do need tools that help measure app usage and that can help grow their install base and usage. Sometimes 3rd party tools are a viable solution for these needs.
- However apps are challenged to find and engage customers using first-party data strategies and tools that can comply with Apple’s privacy and transparency requirements
- Apps will need time to upgrade their strategies to privacy-centric and transparent solutions. This shift is all the more important and urgent now that their iOS consumers can see for themselves how many networks each app they use is sharing their data with.
Observations by Category
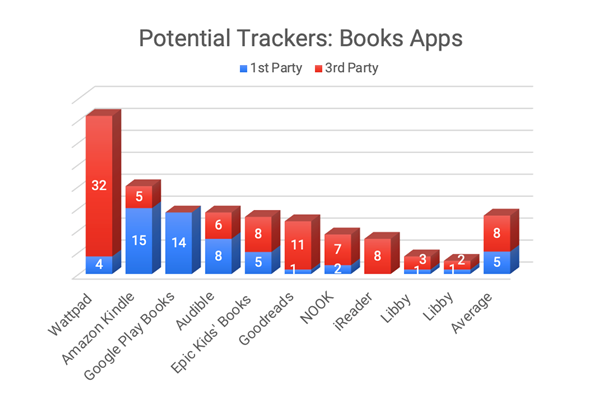
- We analyzed 10 apps in the Books category, including Amazon Kindle, iReader, Audible, Google Play Books, and Wattpad
- These apps averaged 13 contacts - 63% to 3rd party networks, 37% to 1st party neworks
- Wattpad had the highest number of contacts (36) with 89% being 3rd party
- Libby connected to just three (3) networks, with 67% being 3rd party
- Google Play Books made 14 contacts, however, 100% were to 1st party domains
Examples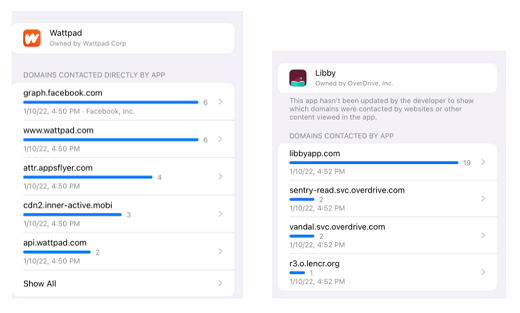
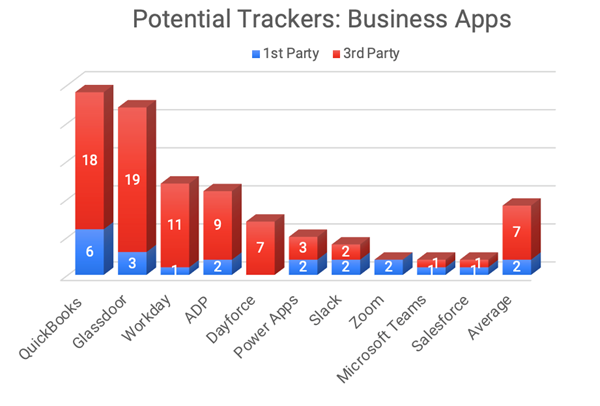
- We analyzed 10 apps in the Business category, including Quickbooks, Zoom, Microsoft Teams, Slack, and Salesforce
- These apps averaged 9 contacts - 64% to 3rd party networks, 36% to 1st party neworks
- Quickbooks made the highest number of connections (24) with 75% being 3rd party
- Salesforce, Microsoft, and Zoom made the fewest number of connections (2). Zoom featured an interesting approach: both network contacts were encoded as raw IP addresses, masking them from consumer scrutiny
Examples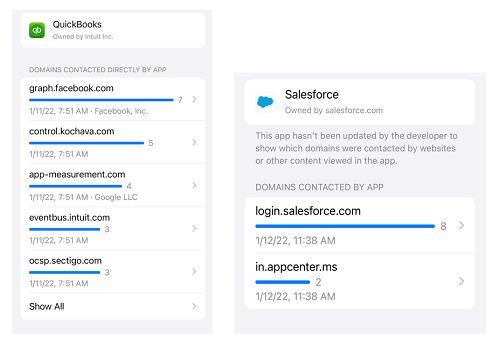
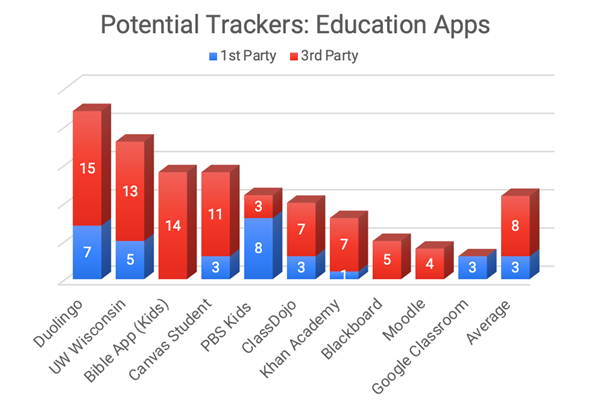
- We analyzed 10 apps in the Education category, including Google Classroom, Canvas, Khan Academy, PBS Kids, and Duolingo
- These apps averaged 11 contacts - 70% to 3rd party networks, 30% to 1st party neworks
- Duolingo made the most connections (22), with just 68% being 3rd party
- Google Classroom made the fewest connections (2), with 100% being 1st party
Examples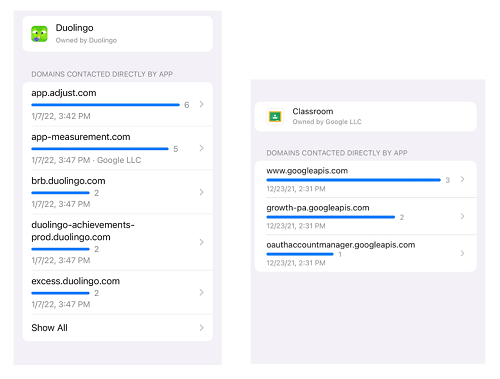
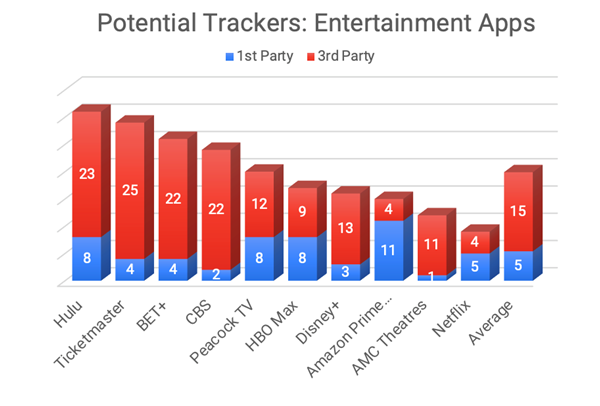
- We analyzed 10 apps in the Entertainment category, including Hulu, Disney+, Netflix, Ticketmaster, HBO Max
- These apps averaged 20 contacts - 69% to 3rd party networks, 31% to 1st party neworks
- Hulu made the highest number of connections (31) with 74% being 3rd party
- Netflix made the fewest number of connections (9), with 56% being 1st party
Examples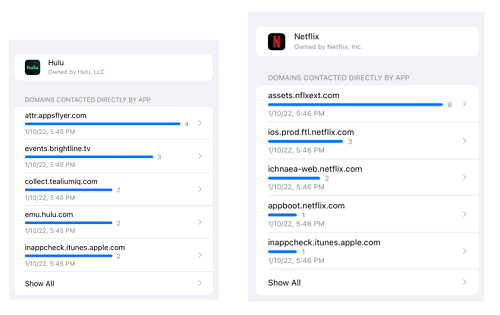
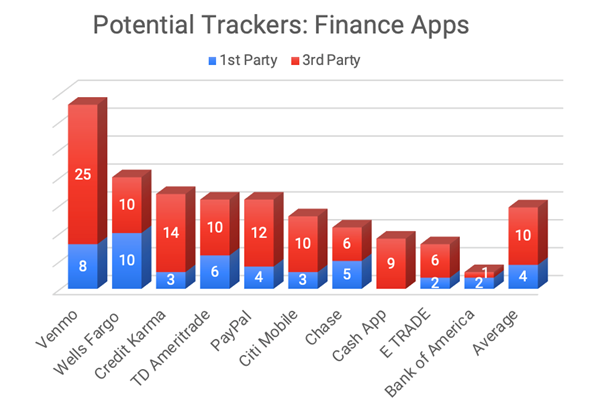
- We analyzed apps 10 in the Finance category, including Citi Mobile, Wells Fargo, eTrade, Venmo and PayPal
- These apps averaged 14 contacts - 69% to 3rd party networks, 31% to 1st party neworks
- Venmo made the highest number of connections (33) with 76% being 3rd party
- Bank of America made the fewest number of connections (3), with 33% being 3rd party
Examples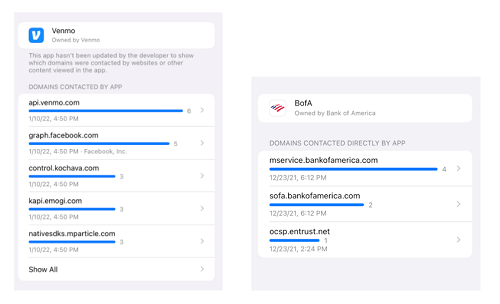
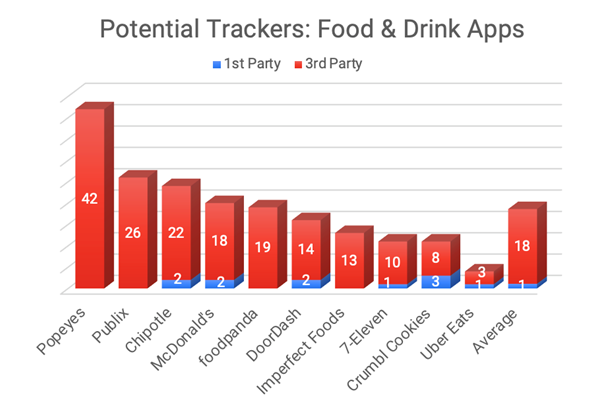
- We analyzed 10 apps in the Food and Drink category, including Popeyes, Publix, McDonald’s, DoorDash, and Uber Eats
- These apps averaged 19 contacts - 92% to 3rd party networks, 8% to 1st party networks
- Popeyes made the highest number of connections (42), all to 3rd party networks
- Uber Eats made the fewest number of connections (4), 75% to 3rd party networks
Examples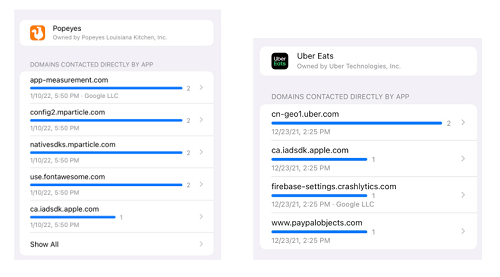
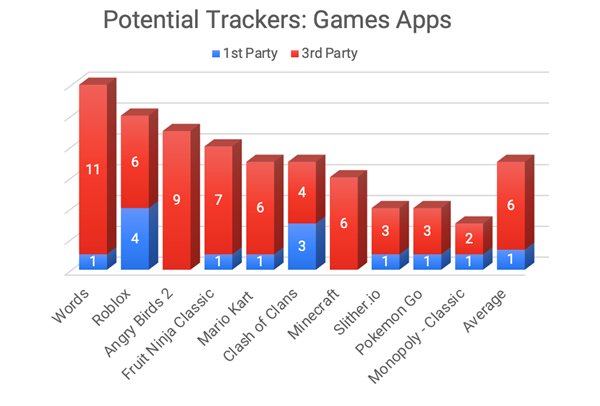
- We analyzed 10 apps in the Games category, including Words with Friends, Roblox, Mario Kart, Minecraft, and Monopoly
- These apps averaged 7 contacts - 80% to 3rd party networks, 20% to 1st party neworks
- Words made the most contacts (12) with 21% being to 3rd party networks
- Monopoly Classic made the fewest contacts (3), with 67% being to 3rd party networks
Examples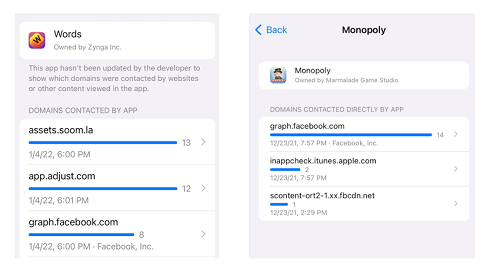
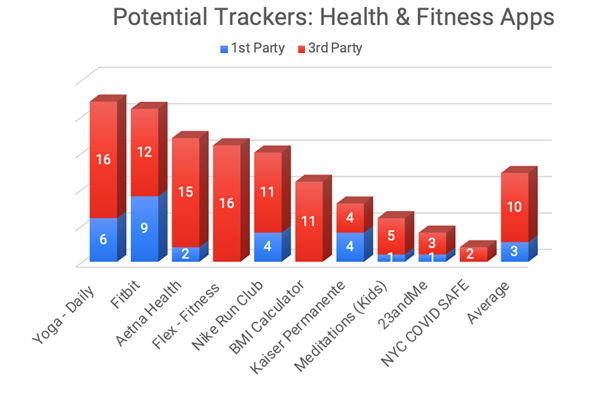
- We analyzed 10 apps in the Health & Fitness category, including Fitbit, Nike Run Club, Aetna Health, Kaiser Permanente, 23andme
- These apps averaged 13 contacts - 80% to 3rd party networks, 20% to 1st party neworks
- Yoga Daily made the most contacts (22), with 73% being 3rd party networks
- NYC COVID SAFE made the fewest number of connections (2), all being 3rd party
Examples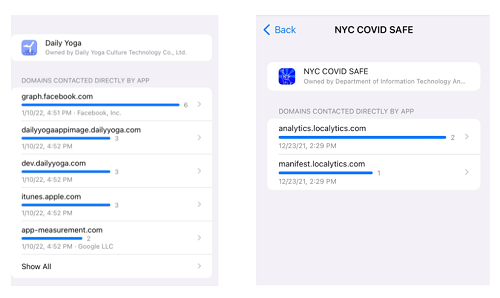
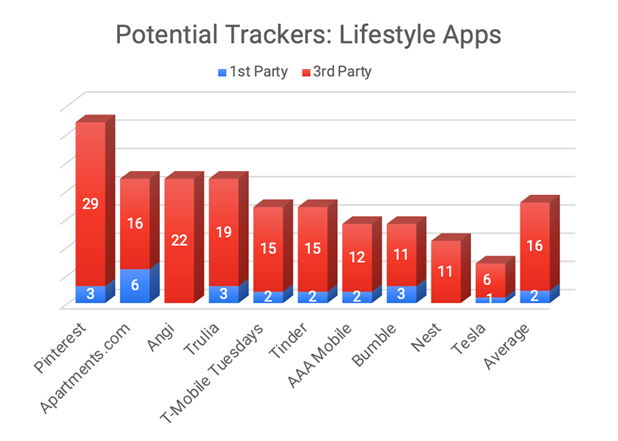
- We analyzed 10 apps in the Lifestyle category, including Pinterest, Angi, Trulia, Tinder, and Nest
- These apps averaged 18 contacts - 88% to 3rd party networks, 12% to 1st party neworks
- Pinterest made the most contacts (32) with 91% being 3rd party networks
- Tesla made the fewest contacts (7), with 86% being 3rd party networks
Examples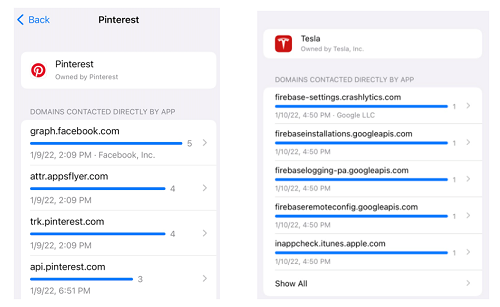
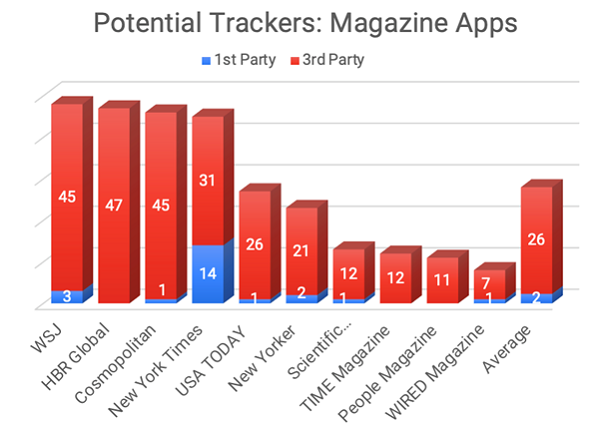
- We analyzed 10 apps in the Magazine category, including HBR Global, Cosmopolitan, Time Magazine, The New York Times and the Wall Street Journal
- These apps averaged 28 contacts - 93% to 3rd party networks, 7% to 1st party neworks
- WSJ made the most contacts (48) with 94% being 3rd party networks
- Wired made the fewest contacts (8), with 88% being 3rd party networks
Examples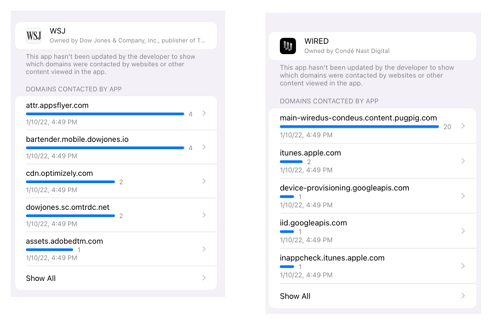
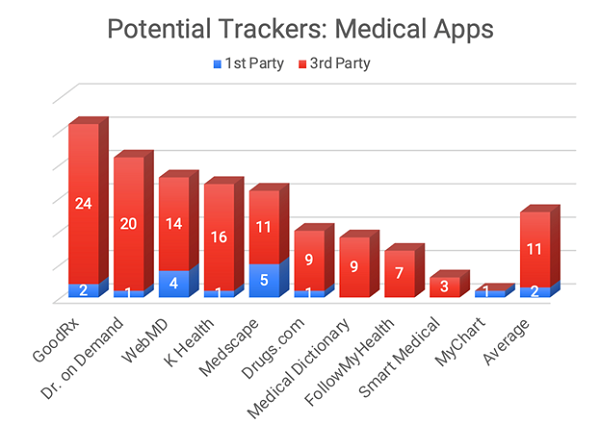
- We analyzed 10 apps in the Medical category, including GoodRx, Doctor on Demand, WebMD, and MyChart
- These apps averaged 13 contacts - 82% to 3rd party networks, 18% to 1st party neworks
- GoodRx made the highest number of connections (26) with 92% being 3rd party
- MyChart made the fewest number of connections (1) and it was 1st party
Examples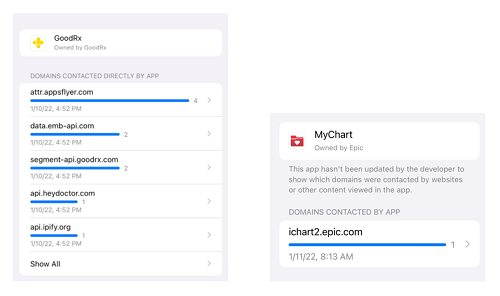
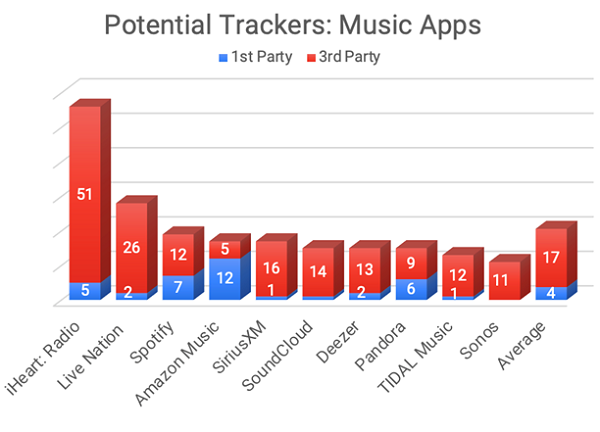
- We analyzed 10 apps in the Music category, including iHeart Radio, Spotify, SoundCloud, Pandora, and Amazon Music
- These apps averaged 21 contacts - 80% to 3rd party networks, 20% to 1st party neworks
- iHeart: Radio made the most contacts (56) with 91% being to 3rd party networks
- Sonos made the fewest contacts (11), with 100% being 3rd party networks
Examples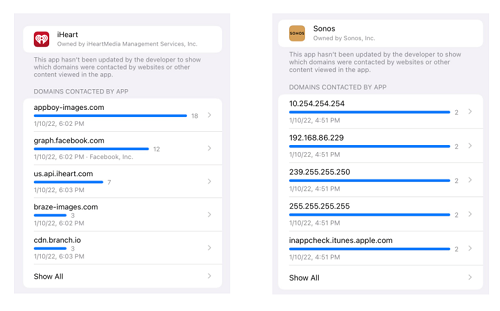
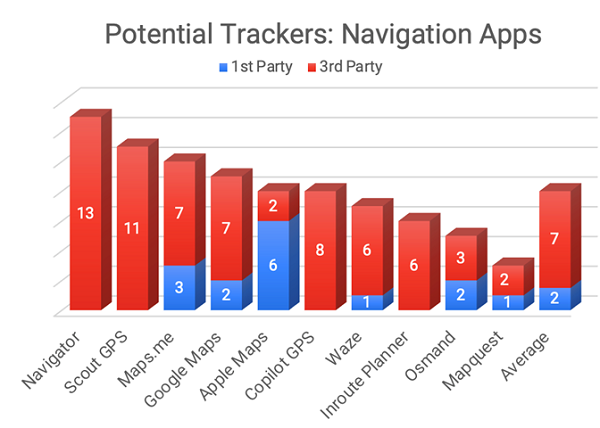
- We analyzed 10 apps in the Navigation category, including Google Maps, Apple Maps, Waze, and Mapquest
- These apps averaged 9 contacts - 79% to 3rd party networks, 21% to 1st party neworks
- Navigator made the most contacts (13), with 100% being to 3rd party networks
- Mapquest made the fewest contacts (3), with 67% being to 3rd party networks
Examples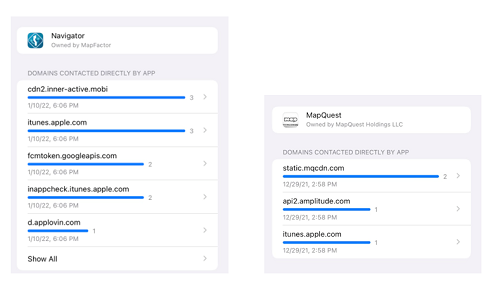
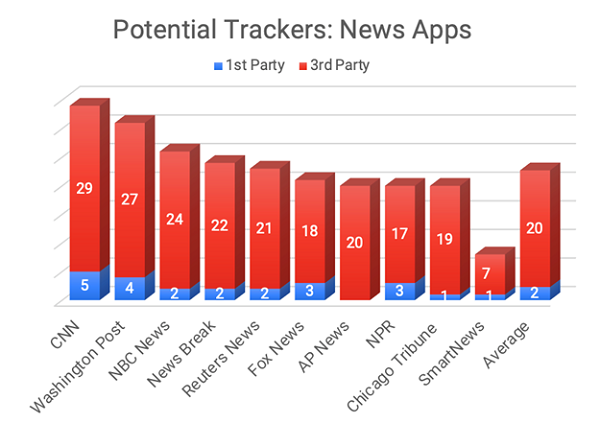
- We analyzed 10 apps in the News category, including CNN, Washington Post, NBC News, NPR, and Foxs News
- These apps averaged 22 contacts - 90% to 3rd party networks, 10% to 1st party neworks
- CNN made the most contacts (34), with 85% being to 3rd party networks
- SmartNews made the fewest number of contacts (8), with 88% being 3rd party networks
Examples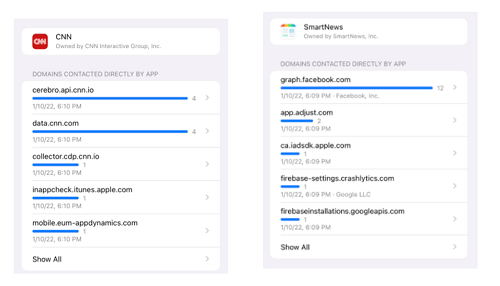
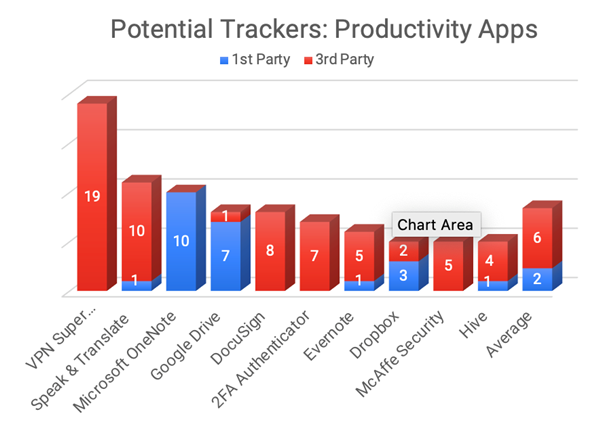
- We analyzed 10 apps in the Productivity category, including Microsoft OneNote, Google Drive, Docusign, and Dropbox
- These apps averaged 8 contacts - 71% to 3rd party networks, 29% to 1st party neworks
- VPN Super Unlimited made the most contacts (19), with all being to 3rd party networks
- Hive made the fewest number of contacts (5), with 80% being 3rd party networks
Examples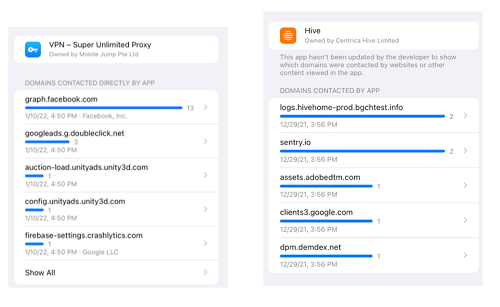
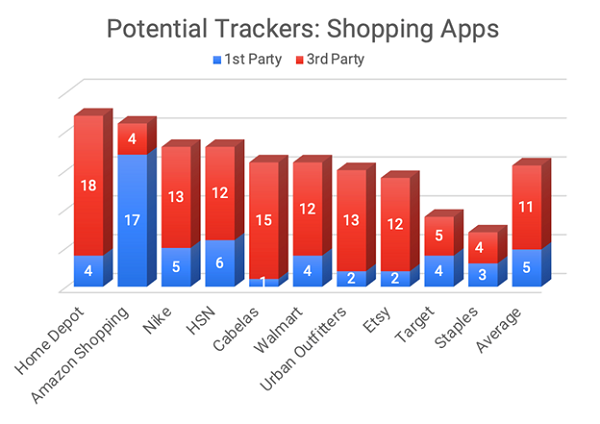
- We analyzed 10 apps in the Shopping category, including Home Depot, Amazon, HSN, Target, and Walmart
- These apps averaged 16 contacts - 69% to 3rd party networks, 31% to 1st party networks
- Home Depot made the most contacts (22), with 82% being 3rd party networks
- Staples made the fewest number of contacts (7), with 57% being 3rd party networks
Examples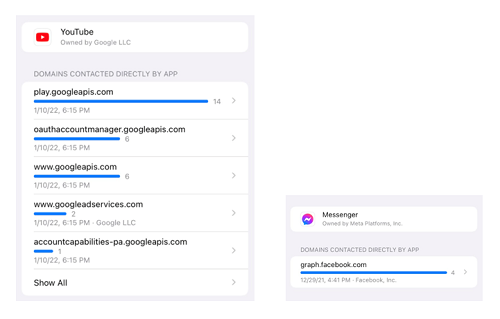
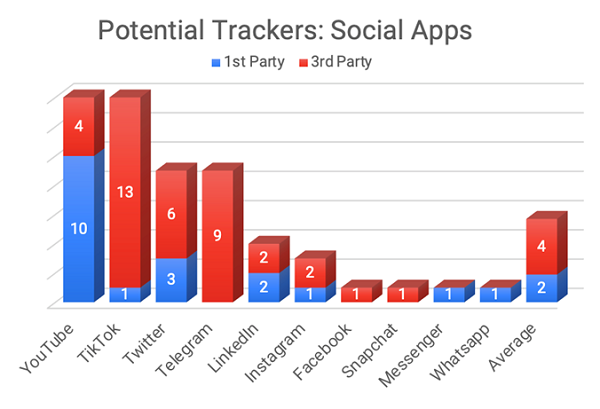
- We analyzed 10 apps in the Social category, including YouTube, TikTok, Telegram, Whatsapp, and Snapchat
- These apps averaged 6 contacts - 60% to 3rd party networks, 40% to 1st party neworks
- YouTube made the most contacts (14), with 71% being 1st party networks
Facebook, Snapchat, Messenger, and Whatsapp all made just one contact
Examples
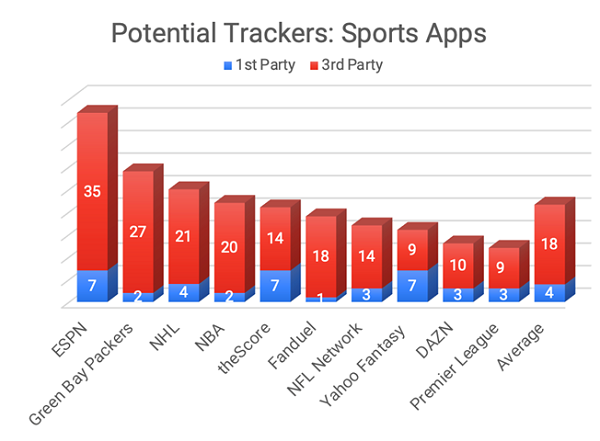
- We analyzed 10 apps in the Sports category, including ESPN, NHL, NBA, NFL, and Yahoo Fantasy
- These apps averaged 22 contacts - 80% to 3rd party networks, 20% to 1st party neworks
- ESPN made the most contacts (42), with 83% being 3rd party networks
- Premier League made the fewest contacts (12), with 75% being 3rd party networks
Examples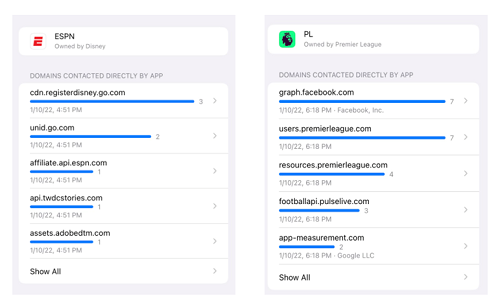
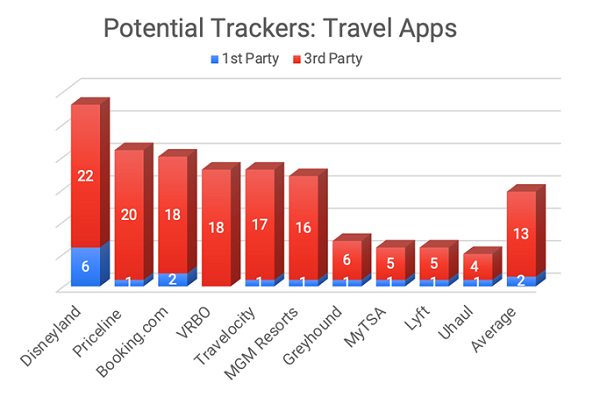
- We analyzed 10 apps in the Travel category, including Disneyland, VRBO, MGM Resorts, Lyft, and Travelocity
- These apps averaged 15 contacts - 88% to 3rd party networks, 12% to 1st party neworks
- Disneyland made the most contacts (28), with 79% being 3rd party networks
- Uhaul made the fewest contacts (5), with 80% being 3rd party networks
Examples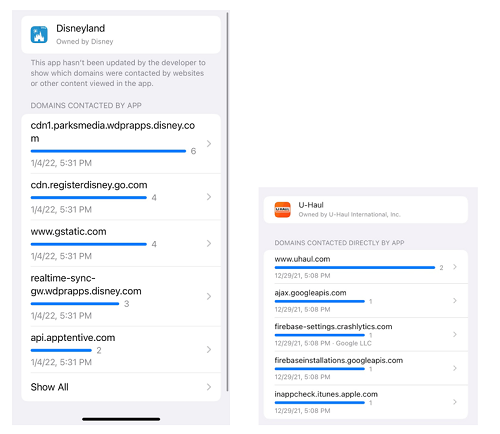
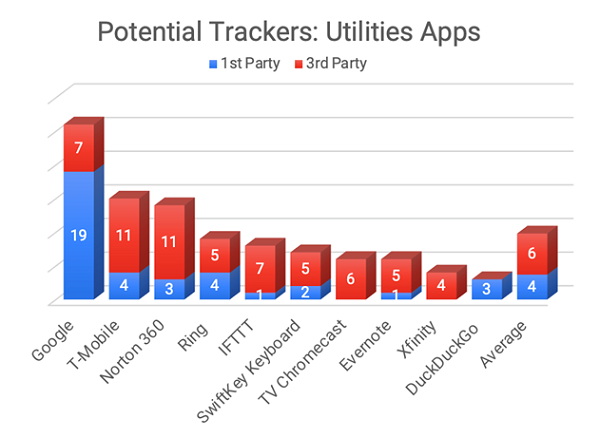
- We analyzed 10 apps in the Utilities category, including Google, T-Mobile,
- Ring, Evernote, and DuckDuckGo
- These apps averaged 10 contacts - 68% to 3rd party networks, 32% to 1st party neworks
- Google made the most contacts (28), with 73% being 1st party networks
- DuckDuckGo made the fewest contacts (3), with 100% being 1st party networks
Examples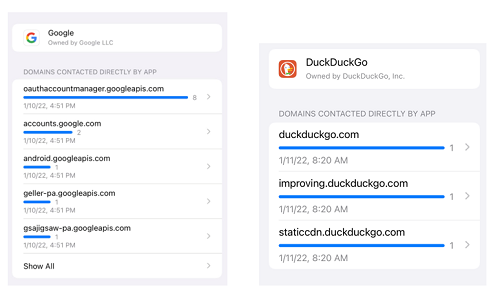
Methodology
- This research uses the Record App Activity feature introduced in iOS 15.2
- The iOS setting to “Allow Apps to Request to Track” remained in the off position
- Ten recognizable brand apps were selected from twenty of the most popular iOS categories
- Each app was downloaded and opened once, with minimal interaction, then closed.
- To be specific, all app login attempts and account creation forms were avoided, and requests for notifications declined. This step helped identify each app’s baseline set of network contacts (“potential trackers”) that were invoked by any / every user opening the app
- We felt the above step was important as repeat and/or multi-screen use of an app increases the networks contacted and potential trackers invoked. Focusing on the baseline set of potential trackers allowed for more fair comparisons across categories
- The App Privacy Report was opened to record all network connections made by each app
- Each app’s Privacy Report results were recorded in a screenshot and tallied by category
- The report shows that some domains were contacted directly by the app and some were contacted by other content.
- These connections can execute actions like capturing and sharing behavioral data (such as which app screens you engaged) as well as “fingerprint” data profiles (pairings of your IP address and device details like screen resolution and OS version to continue to try to identify you and advertise to you online).
- For more information about how an app may share data with third parties consumers can refer to the developer’s privacy policy. Consumers can access these reports on their iPhone by going to Settings > Privacy > App Privacy Report and then select an app under > App Network Activity
Third-Party Domains
We found over 1,100 domains contacted by iOS apps in our research. Here are the 100 most frequently contacted third-party domains.
| Domain Contacted | Contact Count |
|---|---|
| inappcheck.itunes.apple.com | 132 |
| firebaseinstallations.googleapis.com | 99 |
| firebase-settings.crashlytics.com | 86 |
| app-measurement.com | 77 |
| ca.iadsdk.apple.com | 63 |
| graph.facebook.com | 51 |
| firebaseremoteconfig.googleapis.com | 46 |
| itunes.apple.com | 41 |
| scontent-ort2-1.xx.fbcdn.net | 39 |
| firebaselogging-pa.googleapis.com | 39 |
| device-provisioning.googleapis.com | 38 |
| fcmtoken.googleapis.com | 35 |
| dpm.demdex.net | 32 |
| clients3.google.com | 28 |
| assets.adobedtm.com | 28 |
| api2.branch.io | 27 |
| cdn.branch.io | 27 |
| play.googleapis.com | 23 |
| firebasedynamiclinks.googleapis.com | 22 |
| skadsdk.appsflyer.com | 22 |
| conversions.appsflyer.com | 20 |
| mobile-collector.newrelic.com | 20 |
| sb.scorecardresearch.com | 18 |
| ssl.google-analytics.com | 18 |
| attr.appsflyer.com | 18 |
| googleads.g.doubleclick.net | 17 |
| gcdsdk.appsflyer.com | 16 |
| remote-data.urbanairship.com | 14 |
| www.googletagmanager.com | 14 |
| r3.0.lencr.org | 14 |
| mobile-data.onetrust.io | 13 |
| device-api.urbanairship.com | 13 |
| combine.urbanairship.com | 13 |
| ocsp.pki.goog | 13 |
| kvinit-prod.api.kochava.com | 12 |
| c.amazon-adsystem.com | 12 |
| ocsp.sectigo.com | 12 |
| app.adjust.com | 11 |
| c00.adobe.com | 10 |
| launches.appsflyer.com | 10 |
| mads.amazon-adsystem.com | 10 |
| s.amazon-adsystem.com | 10 |
| analytics.localytics.com | 10 |
| cdn.optimizely.com | 9 |
| cdn.cookielaw.org | 9 |
| www.gstatic.com | 9 |
| www.google.com | 9 |
| ocsp.digicert.com | 9 |
| www.googleapis.com | 9 |
| manifest.localytics.com | 9 |
| tpc.googlesyndication.com | 9 |
| nativesdks.mparticle.com | 8 |
| cdn-settings.segment.com | 8 |
| identity.mparticle.com | 8 |
| control.kochava.com | 8 |
| config2.mparticle.com | 8 |
| sessions.bugsnag.com | 8 |
| amp-api.apps.apple.com | 7 |
| optanon.blob.core.windows.net | 7 |
| www.googletagservices.com | 7 |
| braze-images.com | 7 |
| sdk.iad-03.braze.com | 7 |
| www.google-analytics.com | 7 |
| sdk.iad-01.braze.com | 7 |
| px-conf.perimeterx.net | 6 |
| api.apptentive.com | 6 |
| sdk-assets.localytics.com | 6 |
| api.mixpanel.com | 6 |
| pubads.g.doubleclick.net | 6 |
| s3.amazonaws.com | 6 |
| z.moatads.com | 6 |
| fonts.googleapis.com | 6 |
| fonts.gstatic.com | 6 |
| lh3.googleusercontent.com | 6 |
| oauthaccountmanager.googleapis.com | 6 |
| api.segment.io | 6 |
| www.paypalobjects.com | 5 |
| firebaseinappmessaging.googleapis.com | 5 |
| skadsdkless.appsflyer.com | 5 |
| m.media-amazon.com | 5 |
| appboy-images.com | 5 |
| msh.amazon.com | 5 |
| ild.googleapis.com | 5 |
| api-adservices.apple.com | 5 |
| sp.auth.adobe.com | 5 |
| web.facebook.com | 5 |
| device-metrics-us-2.amazon.com | 5 |
| images-na.ssl-images-amazon.com | 5 |
| config.emb-api.com | 4 |
| data.emb-api.com | 4 |
| profile.localytics.com | 4 |
| sentry.io | 4 |
| api.snapkit.com | 4 |
| logx.optimizely.com | 4 |
| mcias-va7.cloud.adobe.io | 4 |
| gsp-ssl.ls.apple.com | 4 |
| fls-na.amazon.com | 4 |
| arcus-uswest.amazon.com | 4 |
| unagi.amazon.com | 4 |
If you found this content helpful, check out some of our related posts:
- Health and Fitness Apps at Risk of Scaring Away Users with Surveillance Marketing
- Finance Apps Putting Consumer Trust at Risk When Permission To Track Denied
- How to Create Privacy-Friendly QR Codes that Open Healthcare Apps
- 5 Privacy-Friendly Ways to Use QR Codes to Promote Finance Apps
- How to Create Scan-to-Call QR Codes That Are Privacy-Friendly
- How to Make Scan-to-Email QR Codes That Are Privacy-Friendly
- How to Setup Dynamic Scan-to-Text-SMS QR Codes
- How to Generate Dynamic QR Codes for Multiple Language URLs
- How to Generate Privacy-Friendly QR Codes That Open TikTok App
- How to Make QR Codes that Open Instagram App
- How to Create Smaller QR Codes That Maximize Scans
- How to Create QR Code Deeplinks That Open YouTube App
- How to Make QR Code Deeplinks That Open Amazon App
- How to Setup Vanity URLs for Your QR Codes and Deeplinks
- How to Create QR Code Deeplinks That Open Spotify App
- How To Make One Link for Apple App Store and Google Play
- How to Deep Link into SMS Text Messages on iOS and Android


